My Bachelor’s Essay
My senior research and writing project at the College of Charleston is complete, and the result of it is my bachelor’s essay. I’ve titled it “Modeling Basketball’s Points per Possession With Application to Predicting the Outcome of College Basketball Games”, and the associated abstract for the paper is below:
In this paper we consider how to model basketball’s points per possession data, and we show that the flexibility provided by a multinomial logistic regression is required for modeling this type of data. We show how to apply this model to ranking college basketball teams, and a method for estimating team win probabilities with this model is provided. We show how to use these win probabilities to fill out an NCAA tournament bracket, and we compare the results of filling out tournament brackets with the multinomial model to the results of a simpler model. We find neither model to be better than the other at predicting NCAA tournament games (in terms of statistical significance).
The paper can be downloaded at
http://www.basketballgeek.com/downloads/ryan_bach_essay.pdf
Also, some data associated with the analyses in the paper can be downloaded at
http://www.basketballgeek.com/downloads/be_data.zip
Going into this project I was unsure how to best model points per possession data, and looking back now it probably seems rather obvious. That said, I certainly learned a lot, and I hope this will be useful to the community. The section on ranking college basketball teams can also be applied to the NBA, and it is what I use to generate my NBA power rankings.
I would like to thank my advisors Dr. Amy Langville and Dr. Martin Jones for their help and guidance throughout this project. It certainly wouldn’t have been possible without their thoughtful insight and support.
I also want to thank @EdKupfer for reading through and providing feedback at the last moment to help me make sure I didn’t make any obvious mistakes. I know others of you read the paper as well, and I thank you too, for surely you would have pointed out any obvious issues, no? 🙂
I plan to continue developing this paper for hopeful publication, so I am certainly interested in hearing any suggestions for improvement.
My 2010 NCAA Tournament Rating Methods
On March 21st I presented some work on rating college basketball teams with an emphasis on estimating win probabilities in future games at SIAM-SEAS 2010. You can download the following presentation for more details of the methods:
Estimating the Probability of Winning a College Basketball Game
In this presentation I look at two ways of modeling college basketball team efficiency data: net efficiency per game (linear regression) and the number of points a team scores on a possession (multinomial logistic regression).
These models allow you to estimate various probabilities of events, and the table below lists estimates for each team’s chances of winning the 2010 NCAA tournament:
[table id=7 /]
Both of these models estimate that Duke has a better chance of winning the tournament than the experts estimate, so take these estimates for what they’re worth: imperfect estimates of reality that agree that Duke should be the favorite to win the tournament.
The presentation goes better with an explanation, so post in the comments if you’ve got any questions about what I’m doing with the data.
My 2010 NCAA Tournament Odds
Last year I posted my odds for the 2009 NCAA tournament, and this year I’ve made some improvements to help me fill out my bracket.
This year I’ve modeled the difference in each team’s mean points per possession per game. This model can then be used to estimate the probability of one team beating another team. In other words, I am modeling the difference in the team’s efficiency ratings on a per game basis.
If you’re interested in all of the gory details then be sure to look for another post this weekend, as I’m presenting this and one other method at SIAM-SEAS this weekend, and I plan on posting that presentation here.
The Odds
Kansas is estimated to win the tournament 24.8% of the time, but Duke is close behind with an estimated 24.5% chance of winning. The odds of Kansas or Duke winning is slightly less than 50%, so don’t be surprised if a team other than Kansas or Duke wins.
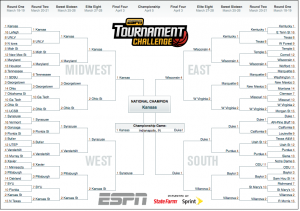
The estimated odds of each team proceeding to each round in the tournament can be found in this spreadsheet. These odds can be used to come up with the following bracket:
Adjusting Individual Defensive Efficiency Ratings
A couple of months ago I presented individual defensive efficiency ratings for the 2008-09 regular season that I extracted from play-by-play data. In this post I will present a method for adjusting these ratings in an attempt to get a clearer picture of a player’s defensive abilities.
Adjusting the Defensive Ratings
To adjust these defensive ratings I fit a multilevel model that allows us to measure the individual offensive, individual defensive, and team defensive impacts on individual efficiency ratings. I fit this model for each of the 2006-07 through 2009-10 regular seasons, and I also fit a single model using all data from those seasons. The results of these fits can be found in the following spreadsheet:
Adjusted Individual Defensive Efficiency Ratings
In this spreadsheet you will find tabs for each of these model fits. The ratings are in terms of the player’s difference from the average defender. Standard errors are listed along with color coded confidence levels. These color codes give us an idea as to how much confidence we have in the estimate. In other words, green means we’re confident the player is not average, red means we have little confidence the player is not average, and yellow is the middle ground between the two confidence levels.
Interpreting the Ratings
To interpret these ratings, you have to think in terms of knowing the defensive player used the possession. For example, Dwight Howard’s 2009-10 rating suggests that when he uses a defensive possession the individual offensive efficiency rating of the player that used the offensive possession is 14.7 points lower than what it would be against an average defender.
It is important to note that because this model shrinks estimates to the mean, bad defenders that get little playing time will be considered average.
These ratings also adjust for the team the player plays for, as Dean Oliver shows in Basketball on Paper how some good defensive players can play on poor defensive teams. The general idea was to try and account for “Dumars-like” players while at the same time control for the idea that one individual doesn’t have complete control over how well a team does defensively.
I haven’t done anything scientific to fully study the impact of this team adjustment, but it seems to make sense after eyeballing the impact of this on players like Pau Gasol and Chris Bosh. Eyeballing something doesn’t give us a ton of confidence, so this adjustment is worth a deeper look in the future.
Players Still Underrated After Adjustment
These adjusted ratings do little to account for the fact that we don’t have a great way of giving credit to defenders when opponents make or miss shots. Guys like Shane Battier that defend the opponent’s best offensive player aren’t going to stand out in these ratings.
What Makes Sense? What Doesn’t?
I’m still trying to learn what makes a good defender, so I’d like to hear your thoughts on what ratings make sense, and which don’t. What players have reputations for being good defenders that this model isn’t estimating well?
College Basketball: Rating Individual 3FG%
My last post presented a model for predicting 3FG% based on a player’s ability, age, and role in the offense. A comment by DSMok1 inspired the model I will present in this post. He writes:
I was considering how best to create an “equalized” measure of 3pt and 2pt % for college players, based on the opposition played and the usage percentage. In other words, I would create a notional percentage for each player based on a usage rate of 20%, playing NCAA-average opposition.
Do you think that you could do a similar regression for 2Pt%, and post it?
Although he specifically requested 2FG%, in this post I will present a model of college basketball 3FG% that controls for player ability, opponent strength, experience, and role in the offense.
The Data
To build this model I collected each player’s made and attempted three point field goals for every season from 2002-03 to 2008-09, and I kept only those player seasons that attempted at least 50 three point field goals. I separated this data by opponent, and I kept track of how often this player was in the data set as a proxy for that player’s experience.
Also, I calculated every player’s usage% for each season. Usage% is the percentage of his team’s possessions that the player can be considered responsible for, as defined by Dean Oliver in Basketball on Paper. Thus this usage% includes assists, and it is constructed using Dean’s formulas for the NBA from his book.
The Model
With this data I fit the following model:
[latex]Pr({\tt 3FG make}) = {\tt logit}^{-1}(\alpha + \beta_{1}({\tt usage}) + \beta_{2}({\tt experience}) + \beta_{3}({\tt long}))[/latex]
This logistic regression was fit as a multilevel model to allow the intercept to vary by player and opponent. This allows us to estimate player ability while controlling for opponent strength. In this model long indicates if the attempt is from the 2008-09 season in which the NCAA moved the three point line back to 20 feet 9 inches from 19 feet 9 inches.
The Results
The average player results are as follows:
- Coefficients: [latex]\alpha = -0.490[/latex], [latex]\beta_{1} = -0.557[/latex], [latex]\beta_{2} = 0.028[/latex], [latex]\beta_{3} = -0.034[/latex]. The p-values for testing if the true values of these parameters are equal to zero are all less than 0.01.
- Usage: The coefficient for usage, [latex]\beta_{1} = -0.557[/latex], suggests that for each additional 1% in an individual’s usage% the odds the individual makes a 3FG attempt are decreased by 0.55%. As we would expect, this suggests that a player that increases their usage from 20% to 21% would expect to see their odds of making a 3pt FG attempt decrease by 0.55%
- Experience: The coefficient for experience, [latex]\beta_{2} = 0.028[/latex], suggests that for each one year increase in experience the odds the individual makes a 3FG attempt is increased by 2.8%.
- Long: The coefficient for the longer 3pt distance, [latex]\beta_{3} = -0.034[/latex], suggests that the odds of making a 3pt shot from the longer distance are 3.3% lower than the odds of making a 3pt shot at the shorter distance.
Player Estimates
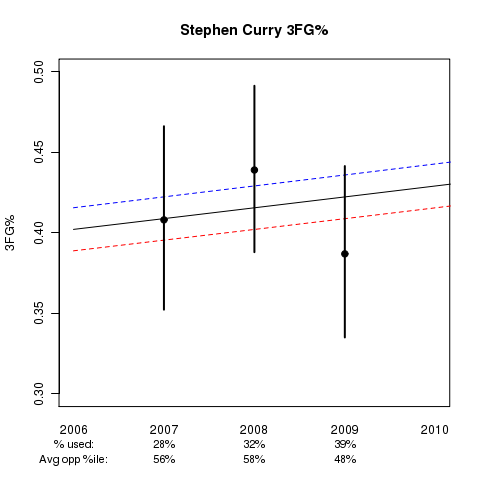
This model fit helps us cut through the noise and estimate a player’s ability against league average opponents. As the graphs below show, there is a lot of uncertainty in a player’s individual 3FG% in any one season. Further compounding these yearly results is the fact that players face different levels of competition, and they may take on a larger role in their team’s offense as they gain experience.
The first graph I will present is that of Davidson’s Stephen Curry:

This graph shows Stephen’s estimated ability as a function of experience (the x-axis) and usage (blue=10% usage, black=20% usage, and red=30% usage). Below the x-axis you will see the actual usage% for each season to go along with the average percentile ranking of opponent 3FG% defense, where 50% represents average, >50% above average, and <50% below average opponents. The black dots and associated lines extending from these dots represent the sample 3FG% for the season and the 95% confidence interval for the player’s true 3FG% ability during the season.
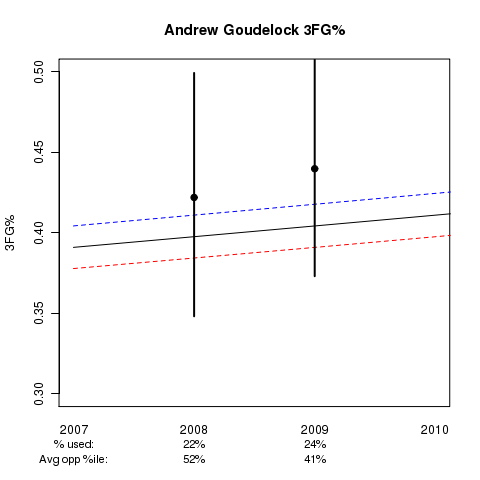
While Stephen ranks 11th in this model of all players from 2002-03 to 2008-09, current star of the College of Charleston, Andrew Goudelock, ranks a surprising 41st. His graph is below:

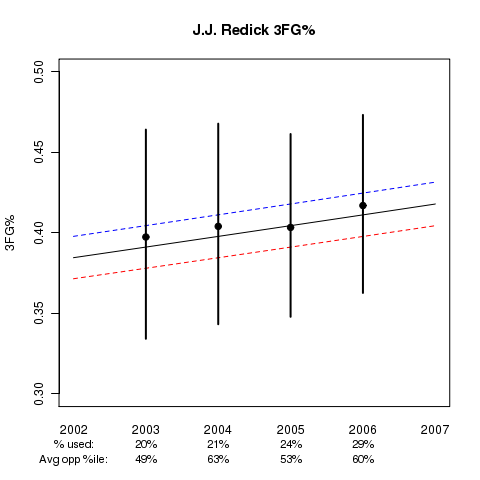
Another player graph that may be of interest is Duke’s J.J. Redick:

Translating to the NBA
Although this model helps us estimate a player’s ability in college, we’re ultimately interested in translating this to the NBA. There are a lot of highly ranked players that never play in an NBA game, as simply being able to shoot 3pt shots well isn’t enough to succeed in the NBA.
That said, the next step is to examine players that actually make it to the NBA and determine what this model says about their ability to shoot 3pt shots against that level of competition.
