Shooting Percentages in the Low Paint
- 8 Comment
This is the first part of a four part series in which I will examine how a player’s shooting percentage at each position is a function of the player’s age, height, and weight. This is a four part series because I will be examining four locations on the court: the low paint, the high paint, mid-range jump shots, and 3pt shots.
Below is background information that will apply to all four parts of this series:
Background: The Data
- Shot locations: For this study I divided the court into 4 distinct areas:
- Low Paint: The area in the paint that is within 6 feet of the hoop.
- High Paint: All other area in the paint.
- Mid-Range: All other 2 point shots.
- 3pt Shots: All 3 point shots.
- Position: A player’s position as designated by by Doug’s stats raw player data, where the positions are PG for point guards, SG for shooting guards, SF for small forwards, PF for power forwards, and C for centers. For clarity, I hold each player’s position constant for every season.
- Age/Height/Weight: A player’s age, height, and weight was constructed using the players.csv file from Database Basketball’s stat download. All ages are as of October 1st of each year, heights are in terms of feet, and weights are in terms of pounds.
- Makes and Misses: A player’s makes and misses from each location come from the 2002-2003 to the 2007-2008 seasons. Thus shot information from 6 seasons were used.
Background: The Method
To fit the data, I used Ed Küpfer’s aging work and Jim Albert’s book Bayesian Computation with R as a guide. For each shot location and position combination, I fit a logistic regression to understand how a player’s age, height, and weight impact a player’s probability of making shots from each location.
So to use the model fit, you need to run logit-1(x), where x is the model fit, and the inverse logit is defined as: logit-1(x) = ex / ( 1 + ex )
Location #1: The Low Paint
Point Guards
Age: Age is not an indicator of a point guard’s chances of making shots at this location of the court. For point guards, age should certainly affect their explosiveness and ability to get shots from this area of the court (something worth studying in the future), but once they are there to attempt a shot, age does not alter what we would expect out of the players probability of then making that shot.
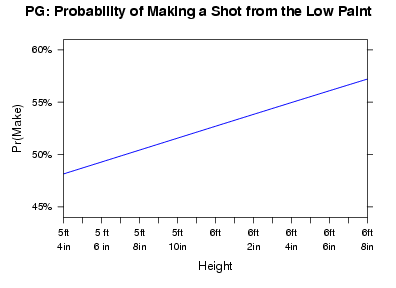
Height: Height, however, is a much different story. As one might expect, height reigns supreme from this area of the court. There is a clear impact, as we would project the tallest point guard in this data set, with a height of 6′ 8″, to make close to 8.5% more shots from this area of the court compared to the smallest point guard in this data set, with a height of 5′ 5″.
Weight: Weight alone has a positive impact, but it is relatively small. This impact can be fully explained by height, as there is a positive correlation between height and weight. Thus knowing a point guard’s height makes the weight data unnecessary.
The Fit: Based on the results above, height (out of age, height, and weight) is clearly the way to project a point guard’s probability of making a shot from this location on the court.
| Intercept | Std. Error | Height | Std. Error |
| -1.5310 | 0.2685 | 0.2732 | 0.0434 |
Graph: The graph below shows how a point guard’s probability of making a shot from the low paint changes based on the point guard’s height.
Shooting Guards
Age: Like point guards, age does not tell us much with respect to shooting guards. I can actually fit a reverse curve to this data when only using age, but that would mean players are really good when they are young, decrease in ability until the middle of their career, and then raise their performance when they get older. This fit has to do with outliers (where only the “best” players are playing at these young and older ages), thus I do not consider this a representative fit. This is shown when fitting height, as this reverse age curve goes away.
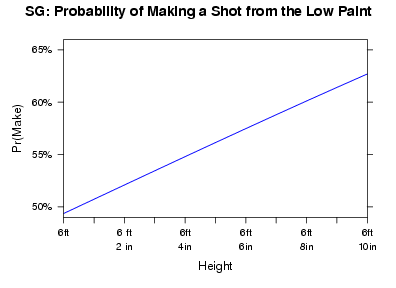
Height: No surprise here, as height again helps explain a lot. In this case, we would expect the tallest shooting guard in this data set, with a height of 6′ 9″, to make almost 10% more shots from this area of the court compared to the smallest shooting guard in this data set, with a height of 6′.
Weight: Weight alone has a positive impact, but again that has to do with the correlation between height and weight. What is different here, however, is that when you combine height and weight, an increase in weight means a decrease in shooting percentage.
This is interesting to me, but taking a closer look at an example helps shed some light into this. A shooting guard is more likely to rely on quickness to get into this area of the court to shoot, so a heavier player at the same height is likely going to lose some quickness when compared to a lighter player. I’m sure there are other explanations that make basketball sense, too.
For example: In this data set, there are 13 shooting guards that are 6′ 7″ tall and weigh anywhere from 244 pounds to 185 pounds. Using the height and weight fit, the heaviest player for this height at 244 pounds is expected to make 2% less of their shots than the player weighing 185 pounds. This is not a huge difference considering the 59 pound weight difference, but this makes sense to me. Thus a combination of height and weight gives us a better picture than simply height alone.
The Fit: Based on the results above, height and weight (out of age, height, and weight) are the best ways to project a shooting guard’s probability of making a shot from this location on the court.
| Intercept | Std. Error | Height | Std. Error | Weight | Std. Error |
| -3.642 | 0.3747 | 0.6532 | 0.0686 | -0.0014 | 0.0006 |
Graph: The graph below shows how a shooting guard’s probability of making a shot from the low paint changes based on the shooting guard’s height.
Small Forwards
Age: For small forwards, a classical aging curve can actually be fit to this data. As Albert shows in his book on page 248, the peak age can be found with this fit, and for this position it is at age 27. The peak age is defined to be (on average): -agec / ( 2 x agec2 ), where agec is the age coefficient and agec2 is the age squared coefficient.
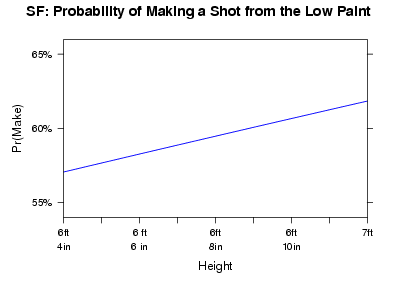
Height: Height again has a positive impact. Holding the ages constant, we would expect the tallest small forward in this data set, with a height of 7′, to make 3.5% more of their shots than the smallest small forward in this data set, with a height of 6′ 4″.
Weight: Like shooting guards, when holding age and height constant, weight has a negative impact on a player’s probability of making a shot. This is a relatively small impact, but it seems to make sense as in the case of shooting guards, so it’s best to leave this coefficient in place.
The Fit: Based on the results above, age, height, and weight all impact a small forward’s probability of making a shot from this location on the court.
| Intercept | SE | Age | SE | Age2 | SE | Height | SE | Weight | SE |
| -2.9660 | 0.4727 | 0.1245 | 0.0214 | -0.0023 | 0.0004 | 0.2978 | 0.0555 | -0.0014 | 0.0005 |
Graph: The graph below shows how a small forward’s probability of making a shot from the low paint changes based on the small forward’s height.
Power Forwards
Age: Like the guards, age does not tell us much about a power forward’s probability of making a shot from this location on the court.
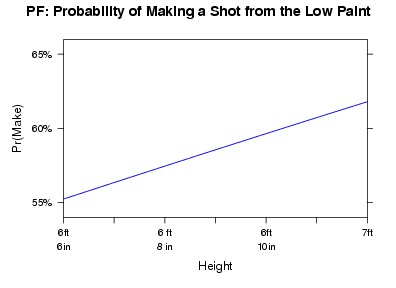
Height: Again, no surprise here, but taller power forwards are more likely to make shots from this location on the court than shorter ones. We would expect the tallest power forward in this data set, with a height of 7′, to make 4.5% more of their shots than the smallest power forward in this data set, with a height of 6′ 7″.
Weight: For the power forward, weight has a positive impact on the probability of making a shot from this location on the court, even when taking height into account. This makes sense when thinking about the role of these players, as a stronger, heavier player is more likely to get better position to create a higher percentage shot.
The Fit: Based on the results above, height and weight (out of age, height, and weight) are the best ways to project a power forward’s probability of making a shot from this location on the court.
| Intercept | Std. Error | Height | Std. Error | Weight | Std. Error |
| -3.8582 | 0.4931 | 0.5413 | 0.0683 | 0.0022 | 0.0004 |
Graph: The graph below shows how a power forward’s probability of making a shot from the low paint changes based on the power forward’s height.
Centers
Age: As with all positions except for the small forward, age does not tell us much about a center’s probability of making a shot from this location on the court.
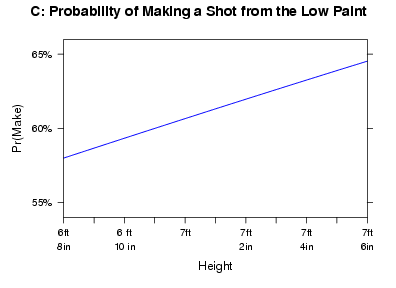
Height: The theme for this location on the court is height, and it again shows a positive impact with the center position. We would expect the tallest center in this data set, with a height of 7′ 5″, to make 7% more of their shots than the center with the smallest height in this data set, with a height of 6′ 9″.
Weight: Like the power forward, weight has a positive impact on the probability of making a shot from this location on the court.
The Fit: Based on the results above, height and weight (out of age, height, and weight) are the best ways to project a center’s probability of making a shot from this location on the court.
| Intercept | Std. Error | Height | Std. Error | Weight | Std. Error |
| -2.404 | 0.4224 | 0.3310 | 0.0639 | 0.0020 | 0.0004 |
Graph: The graph below shows how a center’s probability of making a shot from the low paint changes based on the center’s height.
Summary
Size matters in this area of the court. The taller you are, the better your expectation is on making a shot. Age and weight are a mixed bag, with age really not telling us too much (with the exception of course being the small forward, although this effect is still small). Weight can help explain some change, but it is not a huge impact regardless.
One thing to stress is that a player must still fit the mold of this position to be successful. Height certainly matters, but height doesn’t mean a shooting guard has the ability to isolate a defender and make their way to the hoop. Thus it’s important to keep in mind that this is simply part of the overall picture.
8 Comments on this post
Trackbacks
-
Uncle Cornelius said:
Do you think there is a level of selection bias in a player’s age? Older players will not be sticking around if they are not able to make shots.
January 19th, 2009 at 12:33 am -
Ryan said:
It’s certainly possible, but when I cut out those outliers, it still didn’t show age to be a factor from this area of the court.
The age affects show up in other areas of the court, so it seems to me as if this area is all about height.
January 19th, 2009 at 1:04 am -
Coach Perez said:
I’m certainly interested in seeing how you formulate the next piece of your article. I’m actually very curious to use your formulas on my own players. They are not NBA players, only youths. I wonder what differences will be apparent and what stays the same. Maybe age will make more of a difference?
Thanks,
Coach Perez
February 25th, 2009 at 5:33 pm -
Ryan said:
If at all possible you would want to collect some of this data based on your players. Putting in height and weight of your players into this model is very unlikely to give you what you’re looking for. 🙂
February 25th, 2009 at 5:47 pm
Shooting Percentages in the Low Paint
https://wp-abes-restore-828f.azurewebsites.net/veja-como-votar-bienio-2018-2020/
Shooting Percentages in the Low Paint
https://www.incavel.com.br/como-regular-os-retrovisores-do-seu-onibus/
Shooting Percentages in the Low Paint
http://specylak.com/woocommerce-wpml-master-slider-and-much-more
Shooting Percentages in the Low Paint
https://oh-lux.com/2019/09/16/novedad-de-givenchy-ombre-y-encre-interdite/