Examining Defense: Defensive Four Factors
- 9 Comment
Back at the end of September, I made a commitment to get more defensive for this season. To achieve this goal, I’ve been archiving a bunch of NBA games for extracting data to create a better picture of defense.
So to make the best use of my time, I want to ensure I’m getting data that helps create a clearer picture of defense. To do this, I need to know what information would be most helpful to have.
So for the foreseeable future I will be examining various aspects of defense to understand how defensive lineups are built, and what makes a good or bad defensive unit.
The Goal
The real goal in all of this is to get an idea of how coaching and player ability affect overall defensive efficiency and the individual stats that are collected. Because of this, I will be strictly focusing on each team’s most used lineup.
So our main goal is to understand how a new player would fit into a specific lineup and coaching philosophy. We want to know how this player will impact overall defensive efficiency, and how this player will affect various statistics. More data will certainly be helpful, but collecting data for the sake of collecting data isn’t likely to be useful. Hence this process should help focus areas for collecting data.
An Important Assumption
One important assumption in all of this work is the notion that a team’s goal is to minimize their defensive efficiency. A team’s true goal is to maximize their net efficiency (offensive efficiency – defensive efficiency), but we will not be focusing on this for now.
Four Factors
I feel the best place to start examining defense is Dean Oliver’s four factors. These four factors pave the way to examining each component deeper to better understand how defense works.
The Lineups
As I said before, I will be focusing on each team’s most used lineup. By most used, I mean the lineup that was on the court for the most defensive possessions. To make things a little easier, I’ve chosen to estimate possessions instead of count them. I hope this doesn’t prove to be a mistake, but for the interested, I used the “simple” formula for estimating possessions as defined in A Starting Point for Analyzing Basketball Statistics:
Possessions = 0.976 x (FGA + 0.44 x FTA – OREB + TO)
So for each team in the 2007-2008 season, I calculated various statistics for each team and figured out which lineups had the most possessions. These lineups can be found in the 07-08.def.lineups.txt file.
Factor #1: Shooting
Update: My original text is below, but as it turns out Points per FGA = eFG% x 2. Thanks to Ed for pointing this out to me.
Shooting, by no surprise, has been shown to be the most important factor. This factor is often analyzed using effective FG%. I, however, am biased against effective FG%. It is not actually a percentage, and I find it to have no useful mathematical properties (that I’m aware of, at least). Thus I feel compelled to use a shooting statistic that I can make more sense out of.
The statistic I’ve chosen to use is points per field goal attempt. The general idea is that this statistic tells you the expected number of points a defense gives up per shot attempt. The formula is:
Points per FGA = 2 x 2FG% x Pr(2pt Shot) + 3 x 3FG% x Pr(3pt Shot)
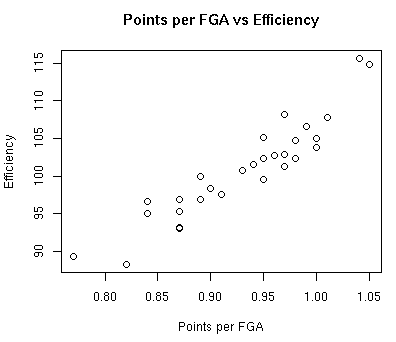
The graph below shows the relationship between points per field goal attempt and defensive efficiency:
The correlation between points per FGA and defensive efficiency is 0.928. So the more points you allow per field goal attempt, the higher your defensive efficiency. Clearly you want to reduce your opponent’s points per FGA.
Factor #2: Turnovers
This factor tells us what percentage of possessions end in a turnover. These turnovers result in a 0 point possession for the opposing offense, so clearly they will have some value.
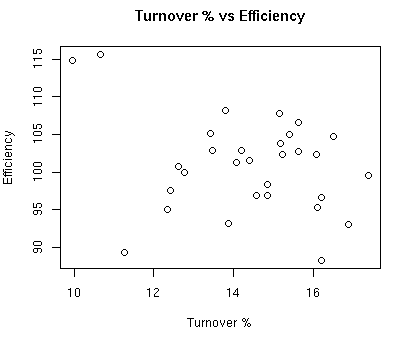
The graph below shows the relationship between turnover % and defensive efficiency:
The correlation between turnover % and defensive efficiency is -0.301. This relationship is much lower than the points per FGA, but an increase in turnover % tends to decrease your defensive efficiency.
Factor #3: Rebounding
This factor tells us what percentage of rebounds the team obtains.
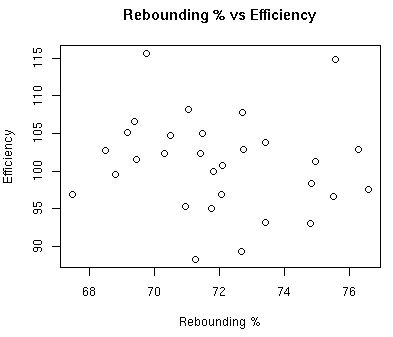
The graph below shows the relationship between rebounding % and defensive efficiency:

The correlation between rebounding % and defensive efficiency is -0.122.
Factor #4: Free Throws
This factor tells us how many free throws the opponent makes per field goal attempt.
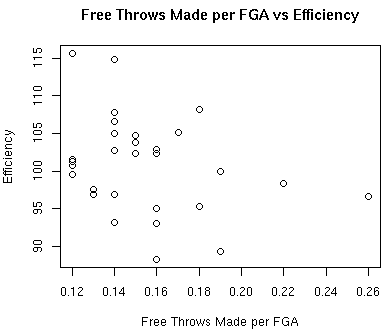
The graph below shows the relationship between free throws made per FGA and defensive efficiency:
The correlation between free throws made per FGA and defensive efficiency is -0.297.
Importance of Each Factor
So one thing we want to know is how important each factor is in terms of defensive efficiency. Ed did some work to show that shooting is worth 45%, turnovers 27%, and rebounding and free throws worth 14% each. The four factor page at B-R.com shows shooting is worth 40%, turnovers 25%, rebounding 20%, and free throws 15%. In Ed’s case, he used team winning % to value the importance of each factor. For B-R.com, I’ve got no idea about the methodology.
The results from this sample show that, with respect to defensive efficiency, shooting is worth 56%, turnovers 18%, rebounding 7%, and free throws 18%. It’s certainly worth gathering a larger sample to truly put some sort of importance weight on each factor, but for this sample it is at least worth looking at.
Summary
There isn’t a lot of ground breaking stuff here that other people haven’t done, but as far as I’m aware of this is the first look at the 5-player unit level.
The next step is to examine each factor in more detail, with the first being shooting. So expect the next post to cover the shooting percentages the lineups allow at various locations on the court.
9 Comments on this post
Trackbacks
-
edkupfer said:
What is Pr(2pt Shot)? Is that 2ptAtt/FGA or 2ptAtt/poss or something else? If it’s the former, then pts/fga = eFG%×2. If it’s the latter, I am not happy with it since it is affected by offensive rebounding and turnovers, which doesn’t make sense to me.
Not that it will make any difference to the correlations, but I hate having to learn new metrics.
February 22nd, 2009 at 10:04 pm -
Ryan said:
It’s the former. Pr(2pt Shot) is just FG2A / FGA, and Pr(3pt Shot) is just 1 – Pr(2pt Shot) = FG3A / FGA.
Yeah I’d much rather work with eFG% if it makes sense, but in this case I don’t see it. 🙁
For example, ATL’s lineup in this sample has a points per FGA of 0.87. Their eFG% is 38%. 2 x 0.38 = 0.76.
I understand eFG% weights FG3M to make up for the fact that it’s worth 3 pts, but the mathematical properties that would make me want to work with it pass me by.
Edit: I figured out what I was doing wrong. This makes me so happy. I <3 eFG% now. I feel like a retard, but at least it is all clear to me now. I'll only be using eFG% only in the future. Thanks for pointing me in the right direction Ed.
February 22nd, 2009 at 10:19 pm


[…] my last post I took a broad look at how the four factors impact a lineup’s defensive efficiency. This post […]
[…] would like to understand defense better (who wouldn’t?), and my post on the defensive four factors and shooting versus defensive efficiency were basic steps at that. This isn’t surprising, but […]
Examining Defense: Defensive Four Factors
https://www.chat-erotico.net/5591-first-taste-ch-02-a.html
Examining Defense: Defensive Four Factors
https://uttarbangajournal.com/শিলিগুড়িতে-সেগুন-কাঠ-পাচ/
Examining Defense: Defensive Four Factors
https://dejavuweb.com/adriana-trato-de-valorizar-y-revalorizar-la-ninez/
Examining Defense: Defensive Four Factors
https://addictionblueprint.com/blog/psilocybin-magic-mushrooms-and-mental-illness/
Examining Defense: Defensive Four Factors
https://claytontimes.com/david-wasinger-announce-run-state-auditor/