My 2009 NCAA Tournament Odds
- 15 Comment
Brackets are now closed, and the first NCAA tournament game of the 2009 tournament is about to begin. Therefore, it’s time I post my odds of winning the tournament.
The Method
I used Kenneth Massey’s least squares method to rate and rank each DI team’s net points per possession per game. In other words, I used this method to rate each team’s offensive points per possession – defensive points per possession on a per game basis.
To get a handle on the distribution of the net points per possession, I assumed it to be normally distributed and used the sample standard deviation throughout the season for each team as that team’s standard deviation for this distribution.
With this distribution, I setup the brackets and calculated the odds of each team advancing to each round based on every possible matchup combination in the tournament.
The Odds
The spreadsheet below lists the odds of each team making it to the 2nd round:
http://spreadsheets.google.com/ccc?key=pLJimPjd7oqvl3fE7FW7ZfQ
The spreadsheet below lists the odds of each team making it to the Sweet 16:
http://spreadsheets.google.com/ccc?key=pLJimPjd7oqvc5lqxLiS-Cg
The spreadsheet below lists the odds of each team making it to the Elite 8:
http://spreadsheets.google.com/ccc?key=pLJimPjd7oquqFFKGihAXEw
The spreadsheet below lists the odds of each team making it to the Final Four:
http://spreadsheets.google.com/ccc?key=pLJimPjd7oqt6cOX1w5p2Jg
The spreadsheet below lists the odds of each team making it to the championship game:
http://spreadsheets.google.com/ccc?key=pLJimPjd7oquldaMCLvREeg
The spreadsheet below lists the odds of each team winning the championship:
http://spreadsheets.google.com/ccc?key=pLJimPjd7oqsbYEdXALx7Ew
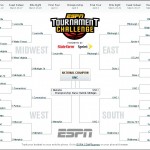
Put all of this together, and you get my bracket:
Who Wins the Title?
These odds suggest UNC is the favorite to win the 2009 championship. That being said, we only expect them to win roughly 9% of the time. Thus we really don’t expect UNC to win the title, as we expect someone else to win it 91% of the time.
Based on a 5 year sample, this method has performed the best. This is clearly a small sample, and weighting the data differently suggests Memphis is the favorite to win (but just at about 11% of the time). This suggests Henry Abbott hasn’t lost his mind. He’s got as good a selection as any.
Thanks
I’d like to thank Dr. Amy Langville, Dr. Martin Jones, Kathryn Pedings, and Patrick Moran for helpful guidance and discussion while fine tuning this method. Also, I’d like to give a shout out to the team from Davidson consisting of Erich Kreutzer and Max Win, who will undoubtedly fall to the competing brackets Kathryn and I submitted to ESPN.
Also, a big thanks to Ken Pomeroy for helping me get points per possession data for the last 5 seasons.
15 Comments on this post
Trackbacks
-
Andrew said:
What are you weighting – the different seasons? So, you weight current seasons more?
March 19th, 2009 at 3:43 pm -
Ryan said:
Actually I am weighting the games throughout each season.
When I reference the 5-year sample, I’m talking about how weighting the games throughout the season have performed historically.
March 19th, 2009 at 3:46 pm -
Andrew said:
I mean “recent” seasons.
March 19th, 2009 at 3:48 pm -
Ryan said:
Just to be clear, I applied a linear, exponential, and logarithmic weight in addition to no weight to the games in each season.
Based on the ratings weighting the games in this manner, I checked how each method performed historically. I hope this clears it up.
March 19th, 2009 at 3:52 pm -
Greg said:
I assume that this does not account for players that are currently injured (i.e. recent injuries that did not have any/significant effect on regular season performance). Correct?
March 19th, 2009 at 4:17 pm -
Ryan said:
That’s correct Greg. UNC’s injury situation certainly is something that I’d like to be able to get a handle on.
March 19th, 2009 at 5:22 pm -
Jeremiah said:
Didn’t see this post until now, but your results, although they rank the teams in a reasonable way, lack face validity. The obvious example is that there is no way that all of the 1 seeds had less than a 90% chance each of defeating their 16 seed opponent, given what we know about the history of these match-ups. How do you account for the fact that similar odds tables produced by Ken Pomeroy give much higher (and I would say, more reasonable) probability estimates?
March 24th, 2009 at 1:07 pm -
Ryan said:
I haven’t done a thorough study of #1 vs #16 seeds, but I would imagine that #16 seeds are “better” than #16 seeds of the past (and maybe #1 seeds are “worse” than #1 seeds in the past?)
This is clearly conjecture on my part, and you do bring up a good point. There could be other motivational/focus factors that come into play that I am not taking into account.
The only issue I have with Ken’s data is that I believe he’s using log5 to calculate the odds. This is nice, but it doesn’t always work as you’d expect. For example, run the results on the #1 and #2 teams. Last yer I believe it gives #1 an over 60% probability of winning. Clearly this isn’t right, either.
So yes you bring up good points and I will be examining this and other such nuances in the future. My hope is that this approximation wsn’t “too far” off, so to speak.
March 24th, 2009 at 1:16 pm

[…] year I posted my odds for the 2009 NCAA tournament, and this year I’ve made some improvements to help me fill out my […]
[…] year I posted my odds for the 2009 NCAA tournament, and this year I’ve made some improvements to help me fill out my […]
My 2009 NCAA Tournament Odds
https://carvajalberber.com/2020/06/02/entrega-griselda-martinez-12-nuevas-patrullas-uniformes-equipamiento-y-bono-a-policias-de-manzanillo/
My 2009 NCAA Tournament Odds
https://maishahealthfund.co.zw/business-directory/baines-imaging-group/
My 2009 NCAA Tournament Odds
http://the-coconut.jp/asoda_TesT/2016/11/21/予防接種/
My 2009 NCAA Tournament Odds
https://www.chat-erotico.net/7595-kristi-s-family-5-a.html
My 2009 NCAA Tournament Odds
https://campinglescargot.ca/blog-2/item/8-pucho-na-alphabet-de-lahoita-mundde-astapun?start=4740