College Basketball: Rating Individual 3FG%
- 988 Comment
My last post presented a model for predicting 3FG% based on a player’s ability, age, and role in the offense. A comment by DSMok1 inspired the model I will present in this post. He writes:
I was considering how best to create an “equalized” measure of 3pt and 2pt % for college players, based on the opposition played and the usage percentage. In other words, I would create a notional percentage for each player based on a usage rate of 20%, playing NCAA-average opposition.
Do you think that you could do a similar regression for 2Pt%, and post it?
Although he specifically requested 2FG%, in this post I will present a model of college basketball 3FG% that controls for player ability, opponent strength, experience, and role in the offense.
The Data
To build this model I collected each player’s made and attempted three point field goals for every season from 2002-03 to 2008-09, and I kept only those player seasons that attempted at least 50 three point field goals. I separated this data by opponent, and I kept track of how often this player was in the data set as a proxy for that player’s experience.
Also, I calculated every player’s usage% for each season. Usage% is the percentage of his team’s possessions that the player can be considered responsible for, as defined by Dean Oliver in Basketball on Paper. Thus this usage% includes assists, and it is constructed using Dean’s formulas for the NBA from his book.
The Model
With this data I fit the following model:
[latex]Pr({\tt 3FG make}) = {\tt logit}^{-1}(\alpha + \beta_{1}({\tt usage}) + \beta_{2}({\tt experience}) + \beta_{3}({\tt long}))[/latex]
This logistic regression was fit as a multilevel model to allow the intercept to vary by player and opponent. This allows us to estimate player ability while controlling for opponent strength. In this model long indicates if the attempt is from the 2008-09 season in which the NCAA moved the three point line back to 20 feet 9 inches from 19 feet 9 inches.
The Results
The average player results are as follows:
- Coefficients: [latex]\alpha = -0.490[/latex], [latex]\beta_{1} = -0.557[/latex], [latex]\beta_{2} = 0.028[/latex], [latex]\beta_{3} = -0.034[/latex]. The p-values for testing if the true values of these parameters are equal to zero are all less than 0.01.
- Usage: The coefficient for usage, [latex]\beta_{1} = -0.557[/latex], suggests that for each additional 1% in an individual’s usage% the odds the individual makes a 3FG attempt are decreased by 0.55%. As we would expect, this suggests that a player that increases their usage from 20% to 21% would expect to see their odds of making a 3pt FG attempt decrease by 0.55%
- Experience: The coefficient for experience, [latex]\beta_{2} = 0.028[/latex], suggests that for each one year increase in experience the odds the individual makes a 3FG attempt is increased by 2.8%.
- Long: The coefficient for the longer 3pt distance, [latex]\beta_{3} = -0.034[/latex], suggests that the odds of making a 3pt shot from the longer distance are 3.3% lower than the odds of making a 3pt shot at the shorter distance.
Player Estimates
This model fit helps us cut through the noise and estimate a player’s ability against league average opponents. As the graphs below show, there is a lot of uncertainty in a player’s individual 3FG% in any one season. Further compounding these yearly results is the fact that players face different levels of competition, and they may take on a larger role in their team’s offense as they gain experience.
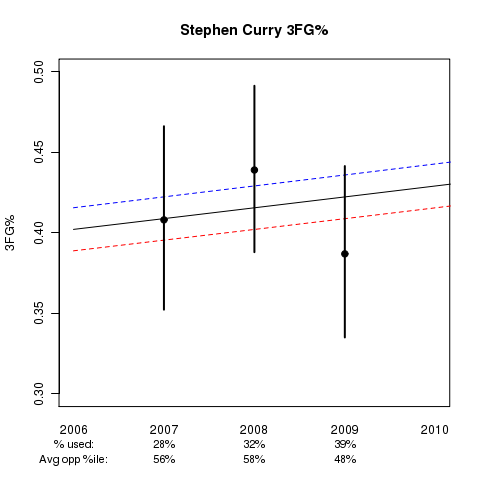
The first graph I will present is that of Davidson’s Stephen Curry:

This graph shows Stephen’s estimated ability as a function of experience (the x-axis) and usage (blue=10% usage, black=20% usage, and red=30% usage). Below the x-axis you will see the actual usage% for each season to go along with the average percentile ranking of opponent 3FG% defense, where 50% represents average, >50% above average, and <50% below average opponents. The black dots and associated lines extending from these dots represent the sample 3FG% for the season and the 95% confidence interval for the player’s true 3FG% ability during the season.
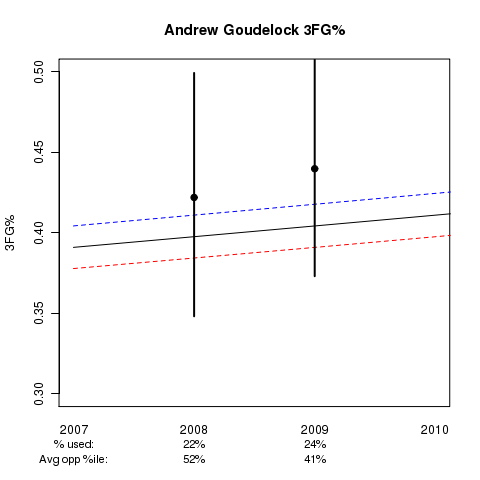
While Stephen ranks 11th in this model of all players from 2002-03 to 2008-09, current star of the College of Charleston, Andrew Goudelock, ranks a surprising 41st. His graph is below:

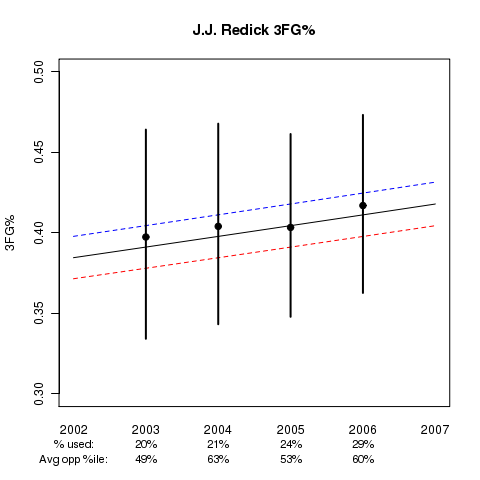
Another player graph that may be of interest is Duke’s J.J. Redick:

Translating to the NBA
Although this model helps us estimate a player’s ability in college, we’re ultimately interested in translating this to the NBA. There are a lot of highly ranked players that never play in an NBA game, as simply being able to shoot 3pt shots well isn’t enough to succeed in the NBA.
That said, the next step is to examine players that actually make it to the NBA and determine what this model says about their ability to shoot 3pt shots against that level of competition.
cheap french bulldog puppies under $500
[…]one of our guests recently advised the following website[…]
french bulldog puppies for sale $200
[…]we came across a cool web site that you could get pleasure from. Take a appear for those who want[…]
lilac frenchies
[…]Sites of interest we’ve a link to[…]
in vitro fertilization mexico
[…]very couple of sites that transpire to be comprehensive below, from our point of view are undoubtedly well worth checking out[…]
french bulldog puppies for sale houston texas
[…]that may be the finish of this report. Right here you will come across some web-sites that we consider youll value, just click the links over[…]
linh hoang
[…]Wonderful story, reckoned we could combine a few unrelated information, nonetheless definitely really worth taking a appear, whoa did 1 learn about Mid East has got more problerms too […]
alexa collins
[…]we came across a cool site that you just may possibly enjoy. Take a look should you want[…]
늑대닷컴
[…]please take a look at the web sites we comply with, which includes this one, as it represents our picks through the web[…]
richest vietnamese american
[…]please go to the sites we stick to, which includes this a single, because it represents our picks in the web[…]
늑대닷컴
[…]Sites of interest we have a link to[…]
wix seo
[…]The info mentioned in the report are a few of the top offered […]
boston terrier puppies in massachusetts
[…]the time to read or check out the content or web pages we have linked to below the[…]
dog probiotic chews
[…]The data talked about in the report are several of the most beneficial accessible […]
dr kim acupuncture
[…]always a massive fan of linking to bloggers that I adore but dont get a whole lot of link adore from[…]
fertility institute of nj
[…]Here is a superb Blog You may Come across Intriguing that we Encourage You[…]
proscar
proscar icd 10
we buy dogs
[…]here are some hyperlinks to internet sites that we link to since we believe they are worth visiting[…]
mexican candy store near me
[…]we came across a cool site that you just may possibly delight in. Take a appear should you want[…]
College Basketball: Rating Individual 3FG%
http://www.coffretderelayage.fr/bonjour-tout-le-monde/?cid=14490
french bulldog texas
[…]Sites of interest we’ve a link to[…]
mexican candy store near me
[…]Wonderful story, reckoned we could combine several unrelated data, nonetheless really really worth taking a appear, whoa did 1 understand about Mid East has got extra problerms also […]
mexican candy store near me
[…]very couple of web-sites that come about to become comprehensive below, from our point of view are undoubtedly effectively worth checking out[…]
College Basketball: Rating Individual 3FG%
http://dergluecklichermacher.de/2018/06/17/das-taeter-opfer-retter-spiel/
surrogacy mexico
[…]Here is a great Weblog You may Locate Exciting that we Encourage You[…]
rent a yacht in cancun
[…]just beneath, are a lot of completely not associated internet sites to ours, having said that, they’re certainly really worth going over[…]
french bulldog usa
[…]one of our visitors not long ago encouraged the following website[…]
chanel bucket hat
[…]although web sites we backlink to beneath are considerably not related to ours, we really feel they’re really worth a go as a result of, so have a look[…]
coco chanel dog collar
[…]The data mentioned in the write-up are several of the very best obtainable […]
playnet
[…]please go to the internet sites we comply with, including this one particular, because it represents our picks through the web[…]
gaming
[…]below youll obtain the link to some internet sites that we consider you’ll want to visit[…]
College Basketball: Rating Individual 3FG%
https://nextpare.com/?p=594
crypto news
[…]below you will discover the link to some internet sites that we think you’ll want to visit[…]
magnolia brazilian jiu jitsu
[…]usually posts some very intriguing stuff like this. If youre new to this site[…]
brazilian jiu jitsu in houston
[…]check below, are some absolutely unrelated web sites to ours, having said that, they’re most trustworthy sources that we use[…]
french bulldog
[…]here are some links to websites that we link to for the reason that we feel they may be worth visiting[…]
bjj jiu jitsu magnolia texas
[…]we came across a cool internet site that you may well delight in. Take a appear for those who want[…]
bjj jiu jitsu cypress texas
[…]usually posts some extremely intriguing stuff like this. If youre new to this site[…]
mexican candy sandia
[…]although internet websites we backlink to below are considerably not connected to ours, we feel they’re truly really worth a go by way of, so have a look[…]