Player Statistics at Home vs Away
- 670 Comment
It has become apparent to me that to we must study the relationship between game situations and the player statistics collected under these game situations before we can fully understand the stats we collect about players. Players enter the game under varying conditions, thus the distribution of game situations is not uniform across all players. Because of this, I feel we can gain insight by studying how these game situations relate to individual player stats.
For example: I’d like to know what sort of relationship garbage time eFG% has to non-garbage time eFG%. This is merely one of many possible questions we can answer by studying game situations.
Home vs Away
The most basic game situation to study is home vs away. We’re all familiar with how much a team’s home court advantage is worth in terms of points or winning percentage, but what about the relationship between a player’s eFG% or turnovers per possession at home vs away?
The Method and Data
Using data collected for the 2006-2007, 2007-2008, and 2008-2009 regular seasons, I calculated the following statistics for each player: FT%, 2pt FG%, 3pt FG%, eFG%, OReb%, DReb%, turnovers per offensive possession, fouls drawn per offensive possession, personal fouls per defensive possession, and steals per defensive possession.
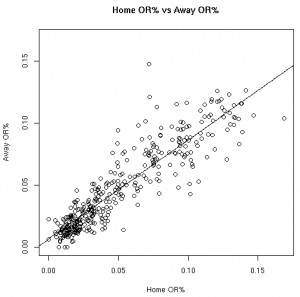
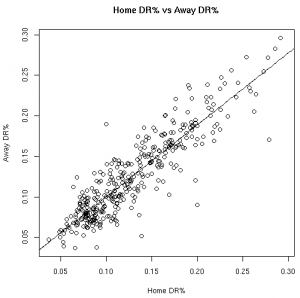
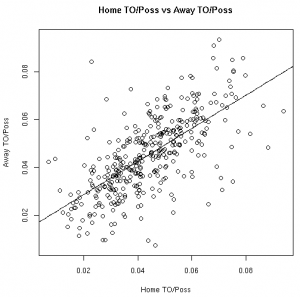
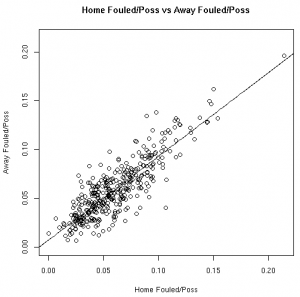
Using R, I calculated correlation coefficients and fit linear models to the data for all players that took part in at least 100 events at home and away in each category (such as 100 FTA, 100 2FGA, 100 3FGA, 100 offensive possessions, etc). See this file for the raw results.
The Correlation Coefficients
| Year | FT% | 2FG% | 3FG% | eFG% | OR% | DR% | TO% | Fouled% | Steal% | Foul% |
| 06-07 | 0.865 | 0.653 | 0.465 | 0.598 | 0.908 | 0.913 | 0.661 | 0.870 | 0.599 | 0.847 |
| 07-08 | 0.835 | 0.655 | 0.151 | 0.612 | 0.896 | 0.933 | 0.675 | 0.855 | 0.586 | 0.857 |
| 08-09 | 0.816 | 0.614 | 0.346 | 0.540 | 0.905 | 0.899 | 0.670 | 0.856 | 0.561 | 0.798 |
The Relationships in Visual Form
As much fun as it may be to look at correlation coefficients, graphing the data with the fitted linear models helps paint a better picture. The graphs below illustrate these relationships from the 08-09 regular season:
| FT% | 2FG% |
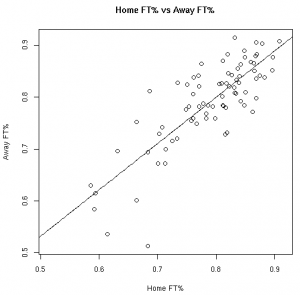 |
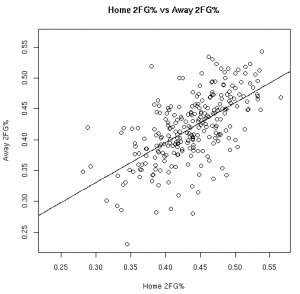 |
| 3FG% | eFG% |
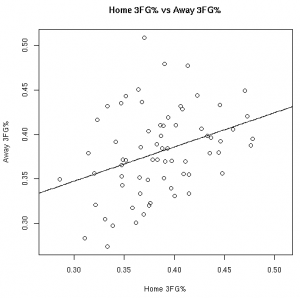 |
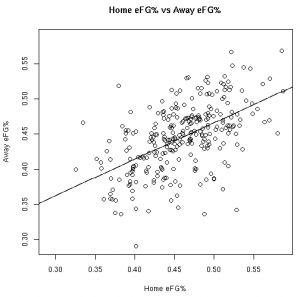 |
| OR% | DR% |
 |
 |
| TO/Poss | Fouled/Poss |
 |
 |
| Steals/Poss | Fouls/Poss |
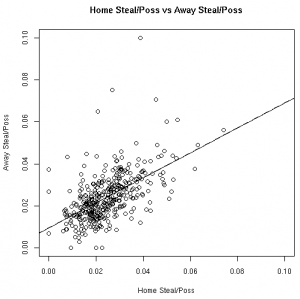 |
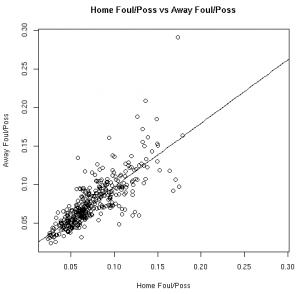 |
Making Predictions
The whole point of this is to make some sort of prediction about a player’s stats given some information (such as how they’ve performed at home).
Based on the models fit to this data, knowing a player’s stats at home gives us information about player’s road stats. (Except, of course, for the models fit to the 3FG% data from the 06-07 and 07-08 seasons).
These results, however, should not surprise anyone. Obviously there is a connection between home vs away stats. Hopefully, however, this helps answer the magnitude of the relationship between a player’s stats at home vs away.
My goal is to use the framework outlined above to quantify the relationship between player stats in other game situations of interest (such as garbage time vs non-garbage time).
Reproduce These Results
To reproduce these results, you’ll need to download the following files:
By running source(“home_vs_away.R”) in R, a file with the raw results will be created. Also, to plot the graphs, simply uncomment the plot() code in the home_vs_away() function.
Summary
This data allows us to quantify the relationship between various player stats at home vs away. Other than the before mentioned 3FG% models, all of the linear models showed the home stats to be statistically significant for predicting the away stats. To use these models, see the raw results file.
UPDATE: Per Nick’s suggestion, I’ve re-scaled the graphics so that the x-axis and y-axis cover the same distance.
denemetitles
denemeexpart
denemetitles
denemeexpart
denemetitles
denemeexpart
denemetitles
denemeexpart
denemetitles
denemeexpart
denemetitles
denemeexpart
denemetitles
denemeexpart
denemetitles
denemeexpart
denemetitles
denemeexpart
denemetitles
denemeexpart
denemetitles
denemeexpart
denemetitles
denemeexpart
denemetitles
denemeexpart
denemetitles
denemeexpart
denemetitles
denemeexpart
Player Statistics at Home vs Away
https://adiwasigana.com/music/nadi-kinare-yekhali-vo-bhiladi-नदी-किनारे-एखली-वो-भिल/
Player Statistics at Home vs Away
https://farmanort.com/mostbet-pl-7/
Player Statistics at Home vs Away
https://archidonaturismo.com/2017/04/06/h/
Player Statistics at Home vs Away
http://www.ofive.tv/2021/09/17/foodie-selection-19/
Player Statistics at Home vs Away
https://www.pragmaticmanufacturing.com/quality-material/